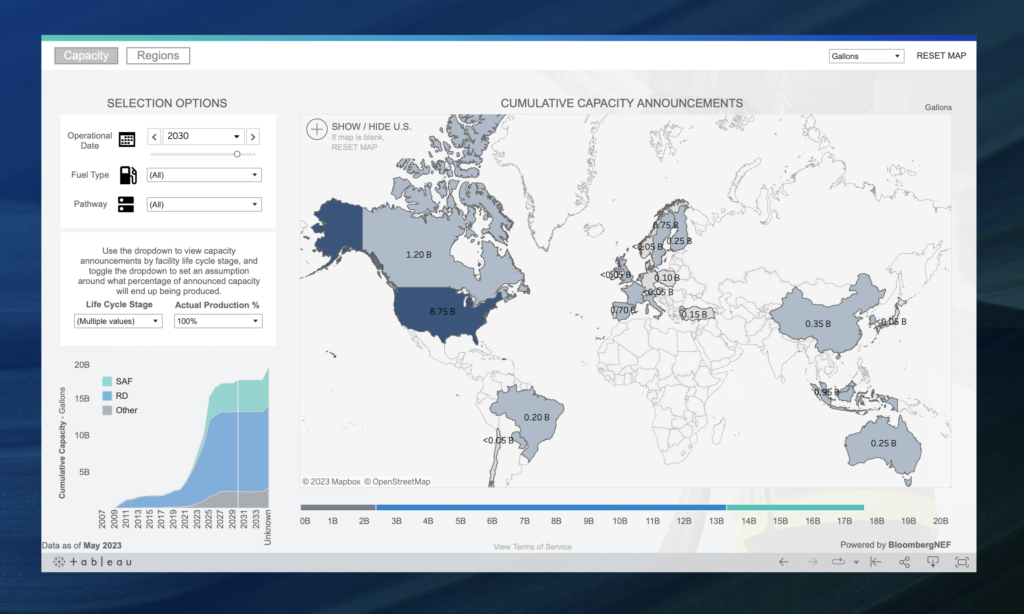
Sustainable aviation fuels, or SAFs, are a critical part of aviation’s medium-to-long-term decarbonisation toolkit, and one where new announcements of future production capacity are coming thick and fast. Tracking these plans is incredibly complex, so Boeing is working in partnership with Bloomberg, offering a new SAF data visualisation dashboard to enable the industry to get its head around the options available.
It was notable at this Paris Air Show just how much of the industry is now behind SAF as a solution — including Airbus, which had previously been almost laser-focussed on hydrogen. While the European aircraft manufacturer is by no means abandoning its hydrogen power ambitions for 2035 and beyond, there is a growing consensus that sustainably powering the aircraft built up to that date, as well as the many non-hydrogen aircraft that will be produced afterwards, will be a necessity.
One of the key challenges of SAF is tracking its commitments and production plans — and convincing suppliers (and potential suppliers) of aviation’s own commitment to SAFs over the decades to come.
Adding to the industry’s toolbox at the Paris Air Show, Boeing unveiled its new SAF Dashboard, a data visualisation tool powered by strategic research from BloombergNEF, data specialists covering a variety of commodities, sector environmental transitions, technologies and sustainability.

Boeing SAF Dashboard. Image courtesy of Boeing
“SAF reduces CO2 emissions by up to 85 percent and possibly more over the fuel’s life cycle, offering the greatest potential to decarbonize aviation over the next thirty years,” explained Boeing chief sustainability officer Chris Raymond at the launch. “SAF Dashboard portrays the data visually as our industry works together across sectors to increase SAF production for a more sustainable aerospace future.”
The dashboard collates information about future capacity announced by SAF suppliers, and its real power comes from the many opportunities to drill down into that capacity by a variety of individual metrics. These include: geographical location (including sub-national production at US state level), capacity, operational date, fuel type (sustainable aviation fuel and/or renewable diesel), the life cycle stage of sites (from planned to operational via investment decision stages and construction), and SAF pathway.
The two main views are by capacity and by region, and are named accordingly.
The Capacity view is perhaps the most compelling, and displays cumulative capacity by country (with an option for US states) up to a certain date. For example, users can drill down to see that France is currently projected to produce some 350 million gallons of sustainable fuel by 2030, of which 100 million are SAF (the rest being renewable diesel), and that the SAF element is planned to come online starting between 2024 and 2026.
The Regions view, by contrast, compares the percentage of SAF being used (as a current or forecast figure) in any one year as a percentage of the total projected aviation fuel demand for that year within that region, with the proviso that this is based on the assumption that SAF would be consumed locally. (This is, by and large, a reasonable assumption.) For example, we learn that in 2023 the Southeast Asia region is at 6 percent, while Eurasia (Europe, Russia, Turkey, the Caucasus, and central Asia, including Mongolia and states of the former Soviet Union) is at 2 percent.
These assumptions are partly based on fleet planning from Boeing’s Cascade climate impact model, which is joined by the SAF Dashboard as part of Boeing’s new Sustainable Aerospace Together hub site. The low, mid and high scenarios from the ATAG Waypoint 2050 projections are also included.
It’s also notable that there is substantial visual space left in the area where users toggle between these two main views, suggesting that the option to add further views is there.
This kind of easy, graphic user data visualisation is incredibly powerful, both for users within the industry and outside it. Demonstrating the scale of the SAF production rampup challenge, as well as the opportunity for potential SAF providers to get into the game, is a key problem for aviation’s decarbonisation — and Boeing’s work here is very valuable indeed.
Author: John Walton
Published 11 July 2023
Feature image: Boeing 787


